Topic Association Insights
Understand your topic landscape
Visualize which brands and domains own the conversation on topics that matter to you and uncover opportunities to increase your influence with powerful graph-based insights.
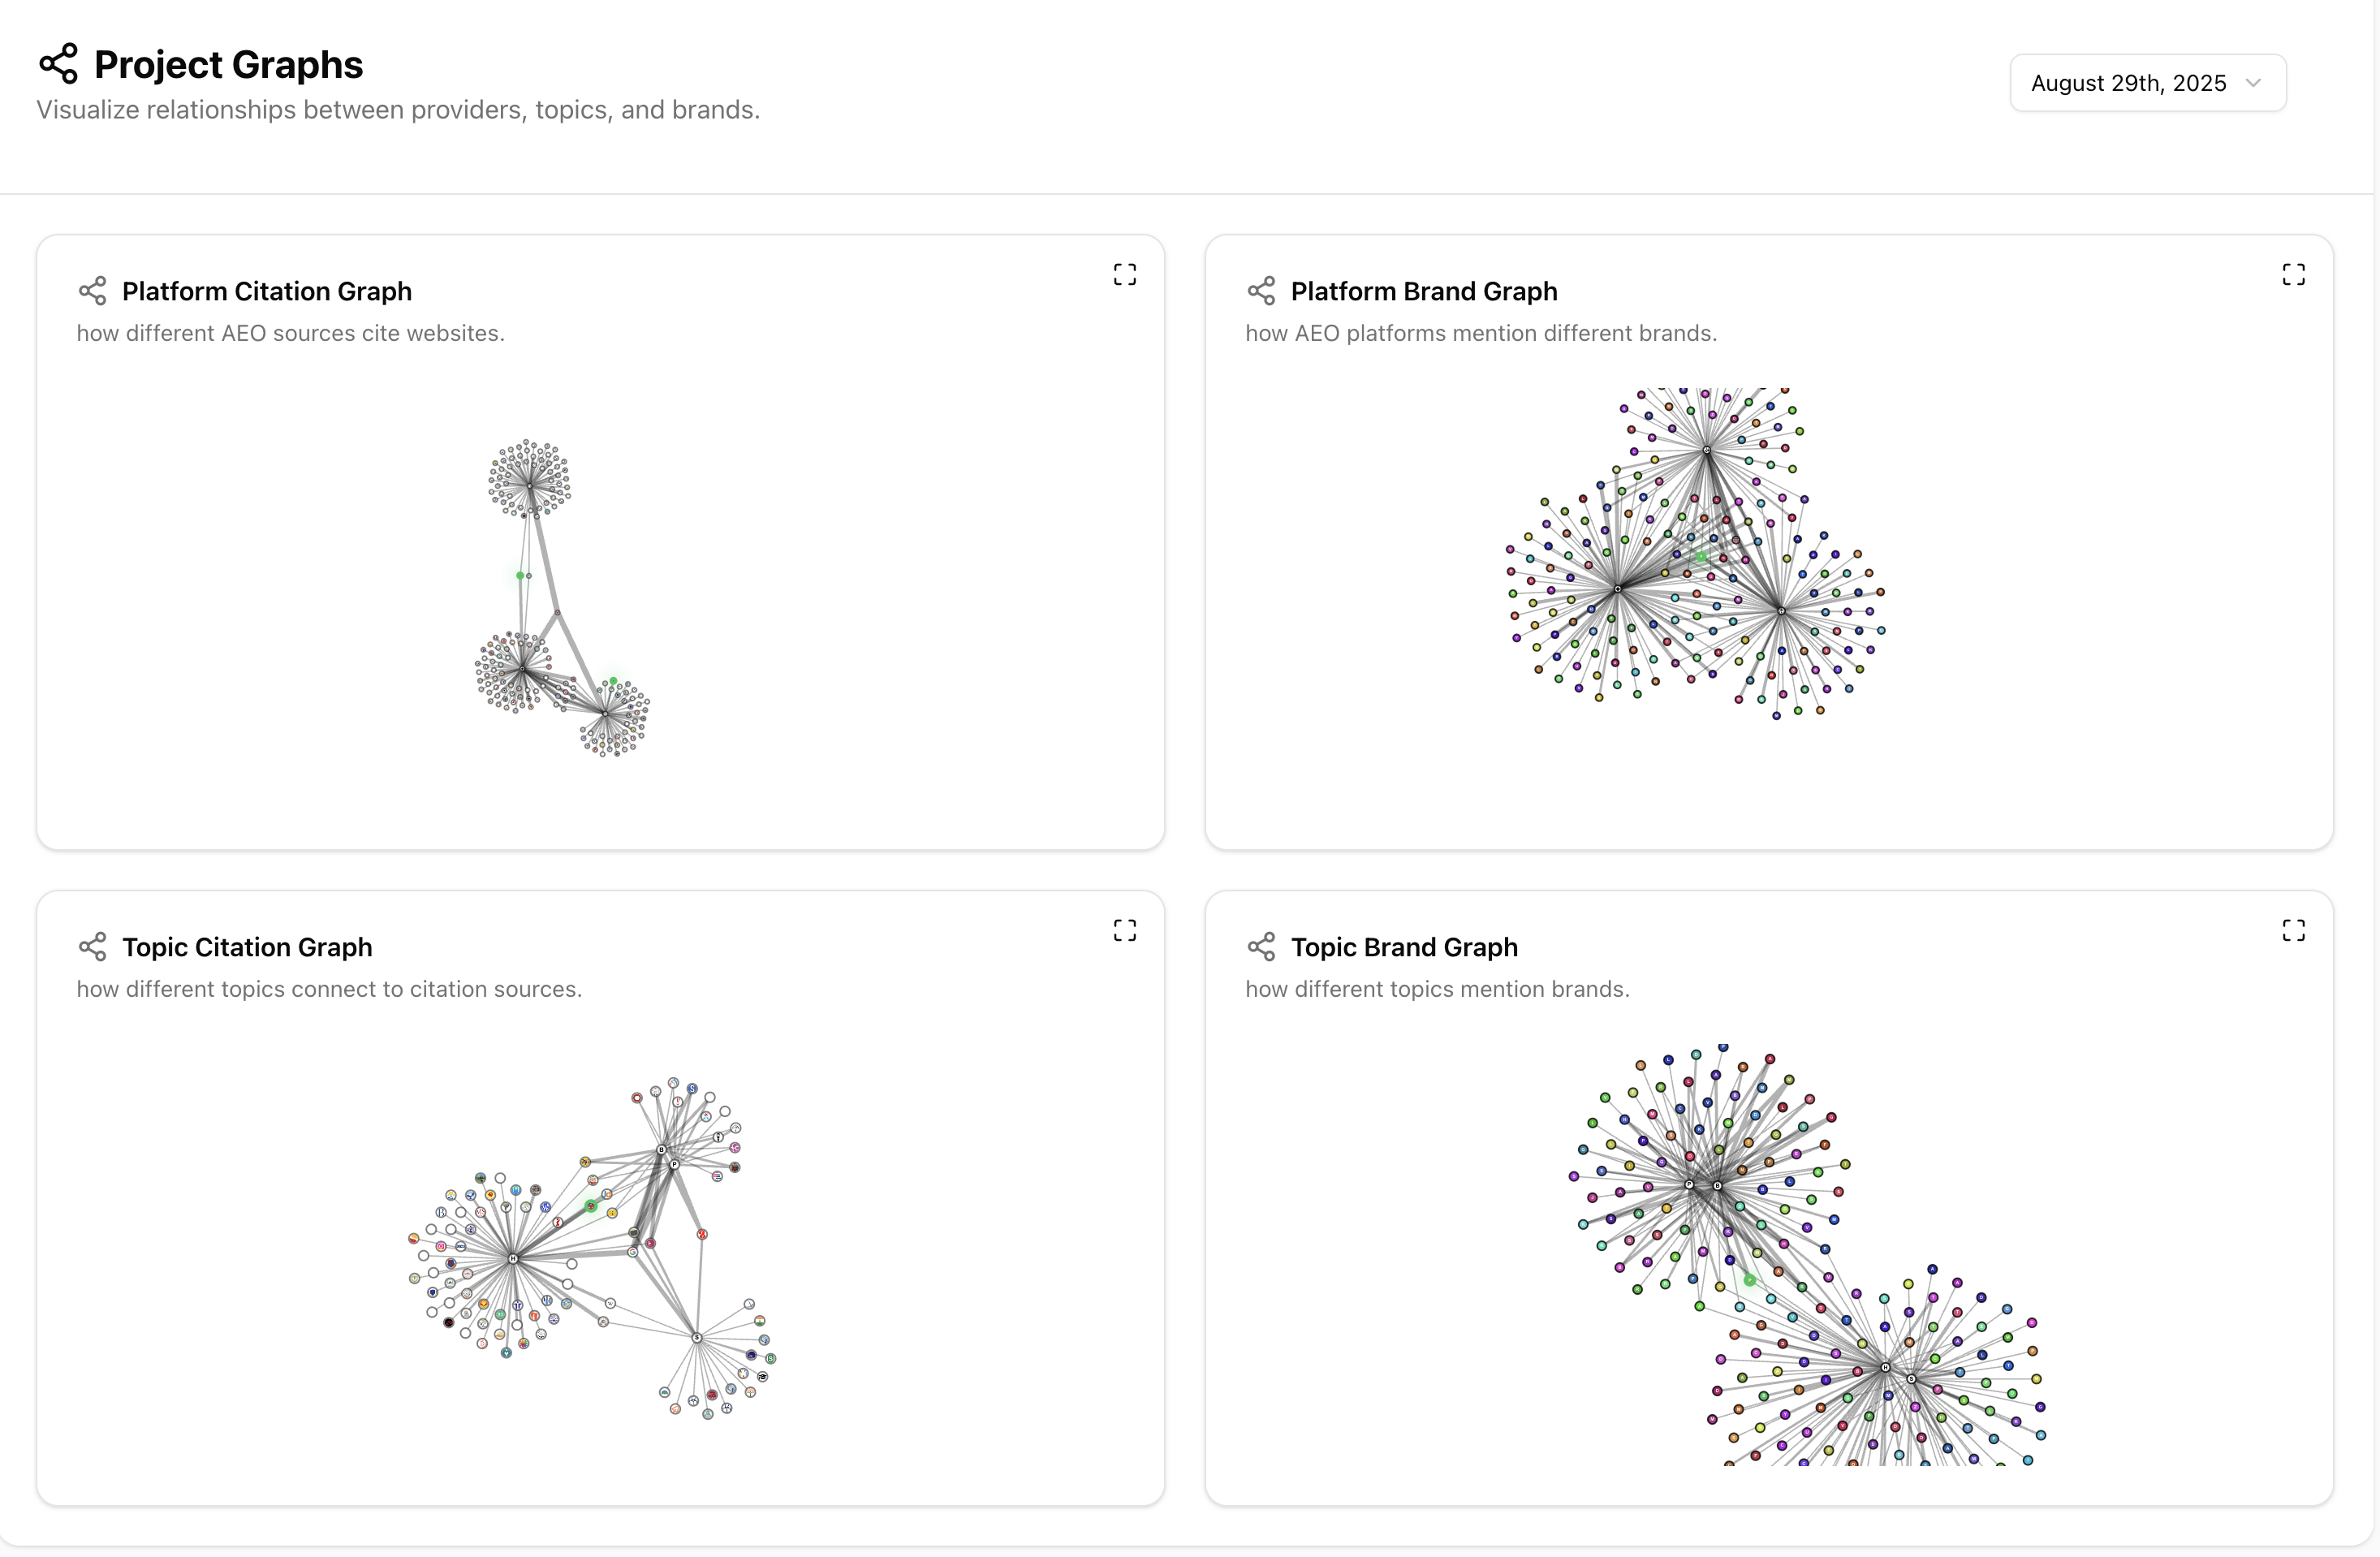
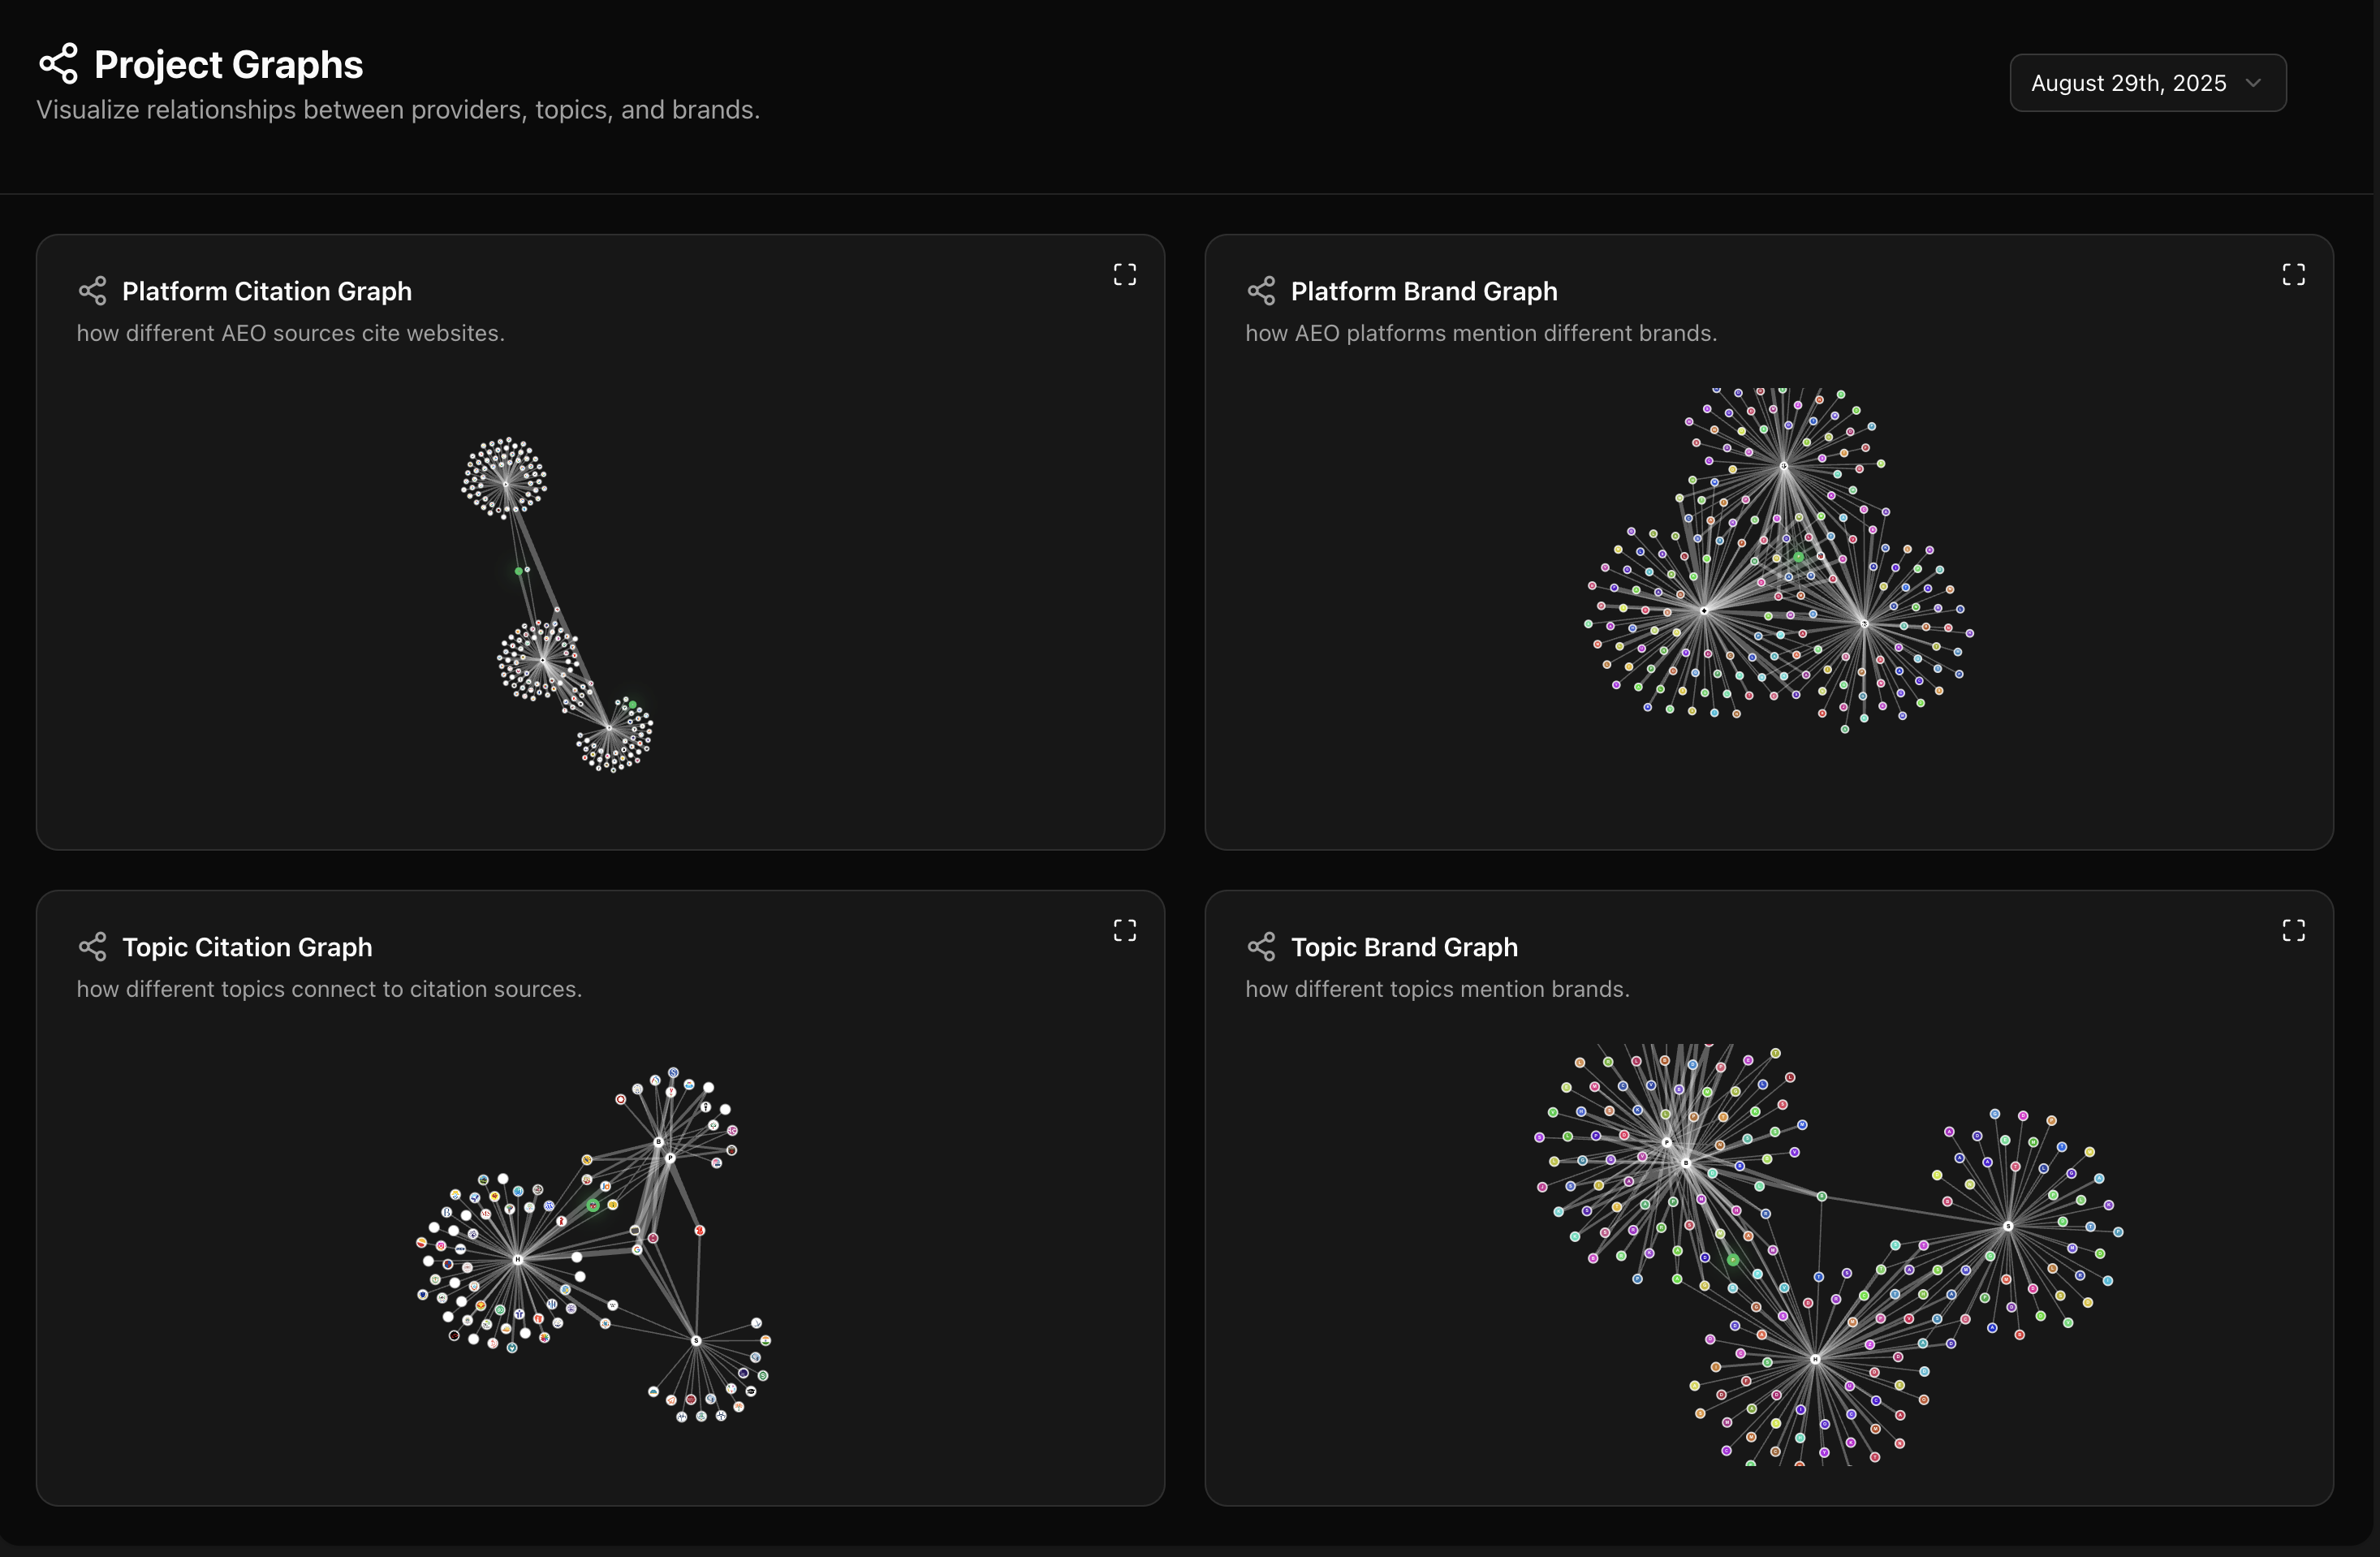
Features
Deep dive into topic influence with powerful visualizations
Topic-to-Brand Relationship Graphs
Visualize topic-to-brand relationships with interactive graphs that show which brands are most associated with key topics in AI conversations.
Topic-to-Domain Relationship Graphs
Explore topic-to-domain relationships through detailed graphs, identifying the domains that have the strongest influence on specific topics.
Content Gap Opportunity Graphs
Analyze content gaps with visualizations that highlight topics where you can build authority and outrank competitors.
Influence Flow Visualization
Chart the flow of influence from domains to brands within any given topic using dynamic, easy-to-understand graphs and visualizations.